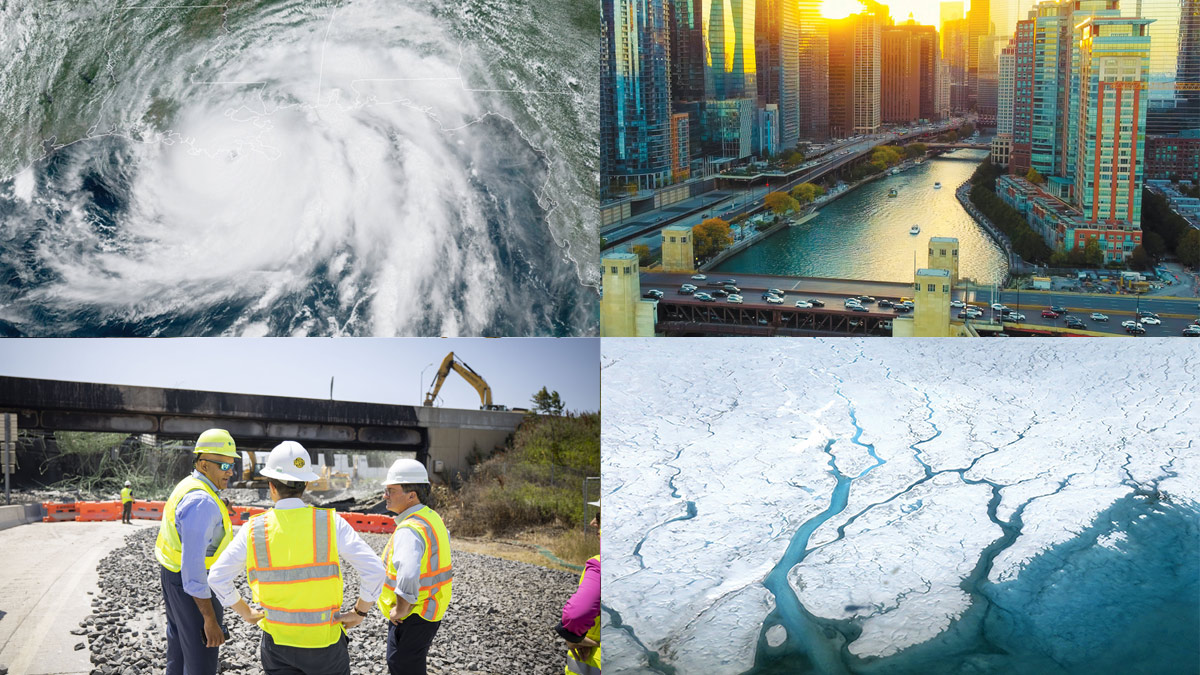
It’s no secret that our infrastructure takes a beating. You see it in the fresh crop of potholes you encounter on the roads each spring and the news reports that flash the devastating toll of storms and wildfires across your screens. Communities are facing increasing challenges from climate change, population growth, and evolving technological threats, while the costs of maintaining and replacing infrastructure continue to rise. In response, ensuring that essential systems can withstand and recover from disruptions is a top priority.
Data science is at the heart of efforts to make infrastructure more resilient. Advanced analytics, machine learning, and predictive modeling allow researchers to assess risks, optimize resource management, and develop smarter strategies for disaster preparedness and recovery. From predicting when bridges will need repairs to strengthening the reliability of the power grid, data-driven insights are transforming how we build and protect infrastructure.
Lehigh has leveraged its strength as a data science powerhouse in the creation of two University Research Centers dedicated to fortifying infrastructure and communities: the Center for Catastrophe Modeling and Resilience and the new Center for Advancing Community Electrification Solutions. Additionally, the Department of Energy funded Lehigh’s Climate Resilience Center, which analyzes extreme water events like droughts and floods in the Lehigh Valley to assess the impact of climate action plans and better understand how different population groups respond to these events.
Beyond these centers, Rossin College faculty are using novel data science tools to measure and mitigate potential flood risk caused by climate change and to conduct innovative research that will protect our ports and bridges. The effectiveness of such efforts is a direct result of the university’s commitment to taking an interdisciplinary approach to study and advance infrastructure resilience, says Brian Davison, a professor of computer science and engineering and department chair.
“That’s what sets us apart as an institution,” says Davison. “We combine expertise across disciplines to create solutions that not only address today’s most pressing issues, but anticipate those we’ll face in the future. Whether we’re using predictive modeling to prepare for natural disasters or developing sustainable energy solutions for communities, our commitment to collaboration and cutting-edge research demonstrates how we use data science as a powerful tool for real-world impact.”
 Advancing fire-resistant design
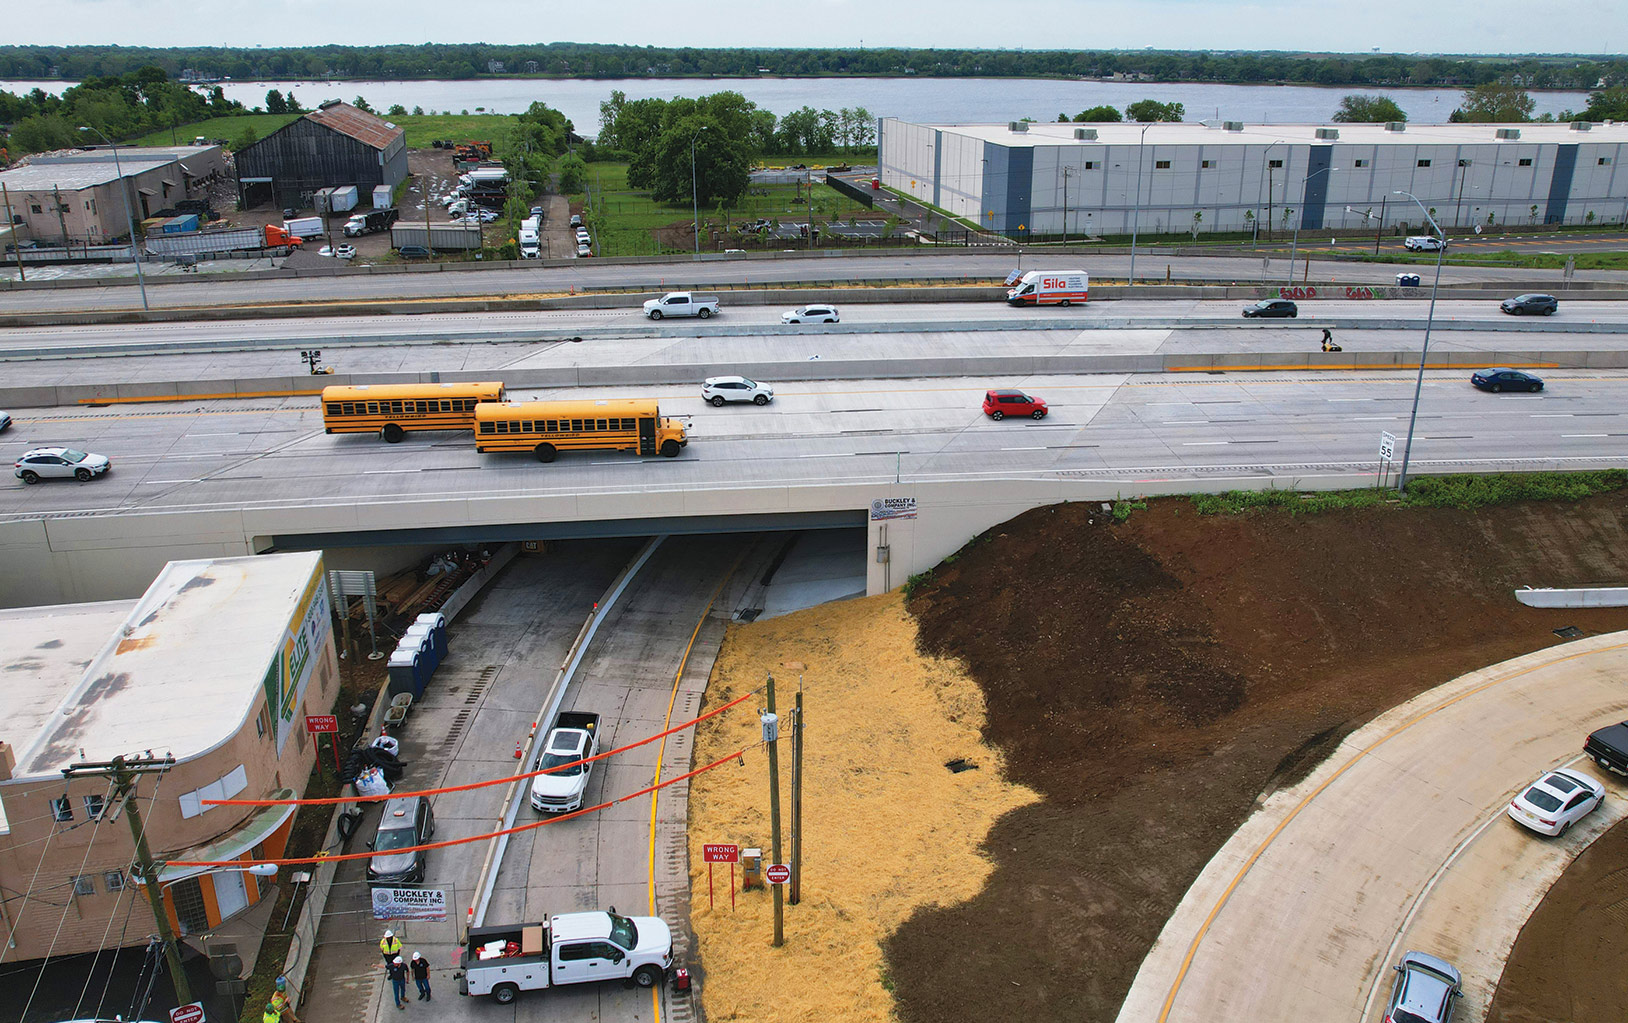
In June 2023, a tanker truck crashed and ignited beneath a bridge on Interstate 95 in Philadelphia, causing the northbound lanes to collapse and severely damaging the southbound lanes. Following the incident, the Pennsylvania Department of Transportation (PennDOT) commissioned engineers at Lehigh to conduct a forensic analysis in which the team modeled the fire by simulating the heat output and spread, assessed how that heat affected the bridge’s components, and evaluated the resulting structural responses.
“Our predictive model performed well,” says Spencer Quiel, an associate professor of civil and environmental engineering, who contributed to the report. “It took about 12 minutes for the first collapse of the northbound span, and the southbound span was sagging significantly when the fire ended about an hour later. Our model closely matched each of the observed milestones during and after the fire.”
Quiel and his team also found that steel girder bridges like the I-95 span were particularly vulnerable when subjected to intense heat; they recommended that heat-resistant coatings could be used to enhance resilience. (Girders are horizontal structural supports critical for strength and stability.)
“We’ve got three specimens of girders that we’ve fabricated in ATLSS [Lehigh’s Advanced Technology for Large Structural Systems Engineering Research Center], and we’re going to test them with different protective materials that PennDOT is interested in exploring,” says Quiel.
As a structural engineer who specializes in fire as a hazard, Quiel has been part of a larger effort to add fire as a load to the ASCE 7 standard, which includes minimum design loads and associated criteria for buildings and other structures.
“We want structural engineers to think about fire not simply as something to add protection against,” he says, “but to consider in terms of, what do you expect to happen, and how do those materials and structures respond? What damage are you left with? Has the thing fallen down? Is it reusable? That’s a huge variation in performance. PennDOT, for example, is interested in engineering to higher levels of performance so that a structure can potentially be reused.”
It’s an approach that can be applied to structures of all types, and it’s especially relevant at a time when wildfires now burn more frequently, for longer, and at hotter temperatures. Buildings and bridges can become more fire resistant if they are made of, or protected with, noncombustible cementitious or stonelike material. Quiel’s research combines physical testing with numerical modeling to determine this response.
For the girder project, the team will first conduct small tests to gather input properties to feed the models. Then they will move on to bigger tests to model different spans—the horizontal section between supports—along with different girder styles and fire durations to gain a more complete understanding of the fire load. The results of these tests validate the models at the element level, and the models can then be used to generate new understanding at the system level. Quiel has done similar work to determine the fire protection rating of floor systems in buildings through a fellowship grant from the American Institute of Steel Construction.
Predicting the impact of cascading hazards
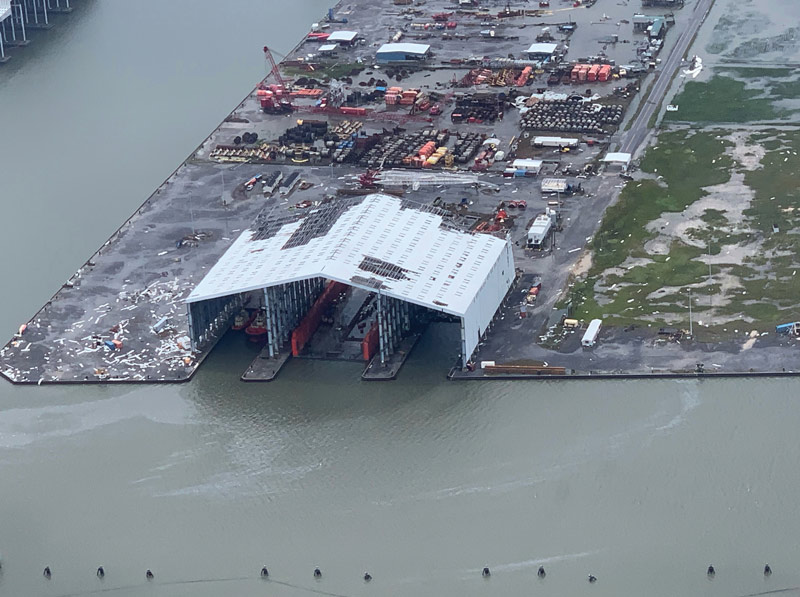
Cláudia Reis, an assistant professor of civil and environmental engineering, has a fascination with maritime ports. In countless ways, these industrial harbors enable life as we know it. According to a report by the United Nations Conference on Trade and Development, more than 80 percent of the volume in international trade is transported by sea.
However, design considerations “are often overlooked or disregarded,” says Reis, who works within Lehigh’s Institute for Cyber Physical Infrastructure and Energy (I-CPIE). “The design of busy ports, which are critical societal infrastructure in regular conditions or even lifeline infrastructure in the case of extreme events, needs to follow operational criteria to prevent disruptions. This requires acknowledging ports’ location in hazard-prone regions and vulnerability to the effects of climate change, such as rising sea levels, which intensify the frequency and severity of natural disasters.”
 Work in Reis’ lab focuses on characterizing the structural behavior of coastal and offshore infrastructure in response to natural hazards with hydraulic components. Specifically, the group explores how water, soil, and structures interact across what she calls the three M’s—multiscales, multiphysics, and multihazards. For example, how an earthquake followed by a tsunami or the wind and the waves of a hurricane will affect infrastructure elements as a synergistic system.
“Instead of considering individual loads from a single hazard, you have cumulative, cascading effects that further weaken the structure,” she says. “And besides the interaction between the natural and the built environment, the interactions among the components of the infrastructure are also considered. So now you’re concerned about not only the deck of the bridge
or the wharf, for instance, but the foundation as well.”
Based on what we know from previous events, Reis continues, “the effects of an earthquake followed by series of tsunami waves induce a combination of soil liquefaction and scouring of the foundations that amplifies the progressive loss of structural resistance. Understanding these interactions will better inform the design and resilience of these critical pieces of infrastructure.”
To that end, Reis uses numerical modeling to solve complex fluid dynamics problems (such as those caused by hurricane and tsunami waves) and simulations to model fluid-structure interactions. The group also develops numerical schemes, physical models tested under controlled laboratory conditions and, lately, cyber-physical approaches to address the “three M’s” problems characteristic of coastal and offshore engineering.
“Our goal is to keep our close engagement with industry partners to provide recommendations for their real-world problems,” she says. For instance, the group is investigating the reinforcement of decks to withstand hydrodynamic loads on the vertical and horizontal components of ports and bridges. Another concern from stakeholders relates to countermeasures to reduce the effects of scour around the piles. “We’ll do complementary physical-numerical simulations, and in the end, we’ll have recommendations.”
Such recommendations are now going into updated design codes that can be applied to new structures and used in the rebuilding or rehabilitation of existing infrastructure. The ultimate goal, she says, is to improve the resiliency of coastal communities and prepare them for scenarios that apply today, as well in 50 or even 100 years from now.
Turning smartphone data into bridge health insights
Budget is often the limiting factor when it comes to the maintenance of our nation’s transportation system.
“Infrastructure in the United States is aging,” says Shamim Pakzad, a professor of civil and environmental engineering and department chair. “In particular, our bridges are aging, and they represent some of our most expensive and critical assets. It’s a problem that will take trillions of dollars to address.”
Pakzad, who is an expert in structural health monitoring, has devoted his research to developing the methods, mechanisms, and algorithms that provide essential information about the condition of infrastructure systems, specifically bridges. His work is shedding light on whether these critical structures need repair or maintenance immediately — or in 2, 5, or 20 years.
He and his team have developed an app that employs the accelerometers in smartphones to collect vibration data (while traveling over a bridge), and they use it to determine structural integrity. When the app senses it’s going over a bridge (through geo-fencing), the accelerometer takes vibration measures from the vehicle’s contact with the surface and sends the data to a cloud location for further processing. The vibrations present as frequencies—or pitches—that indicate stiffness. As a structure degrades, its stiffness decreases.
“When pitch changes, it indicates a softening,” he says. “We’ve shown that we can translate acceleration data, which is the response of the structure, into stiffness measures.”
Having shown that his algorithms work to convert accelerometer data into usable information about bridge degradation, he is taking his research to the next level through transfer learning. In transfer learning, a model trained for one task can be applied as a starting point of sorts to another model involved in a similar task. It streamlines the training for the second model because it is incorporating characteristics from the former.
Their goal now is to measure strain this way.
“Strain can be translated to stress, and stress is basically a measure of how much force you have at each point in your structure,” he says. “To estimate the degradation due to repeated use, what we really want to know is the level and frequency of stress at each point in the structure, but we can’t measure that directly. We aim, however, to measure it indirectly through accelerations.”
All bridges can endure a certain amount of strain, or stress. Every time a vehicle passes over the span, it exerts a certain level of load that produces some degree of stress. Over time, millions of these cycles can cause fatigue cracks. The goal is to understand how many cycles of higher stress a bridge component can safely endure, and then figure out how much of that capacity is left, for any given bridge.
“You measure how many cycles of fatigue load a structural component is experiencing in a defined period of time,” Pakzad says. Then, knowing the bridge’s age, he explains, researchers can determine how many cycles it has experienced in the past and figure out how many years are left before it is likely to break.
Measuring strain/stress, however, is difficult and expensive. But Pakzad and his team have developed a new model using AI that measures acceleration data and converts it into strain data that could then be used for fatigue analysis.
“We have extensively tested our model on single bridges, but you don’t want to have to do that level of testing and training of the models for every bridge. The goal is to be able to use the model for a bridge with similar characteristics. You will just make the necessary adjustments to the model, run it through crowd-sensed data, and that will give you information you need about how to manage the maintenance and repairs of this structure.”
In the future, he envisions an online platform hosting a range of bridge models, which would empower decision-makers to use their local data to inform their actions.
“It could become an important tool for asset allocation because while the major repairs of bridges are expensive, just doing the studies to determine a structure’s condition currently comes with a high price tag,” says Pakzad. “We want to give them that information essentially for free.”
 Smarter models for a changing coastline
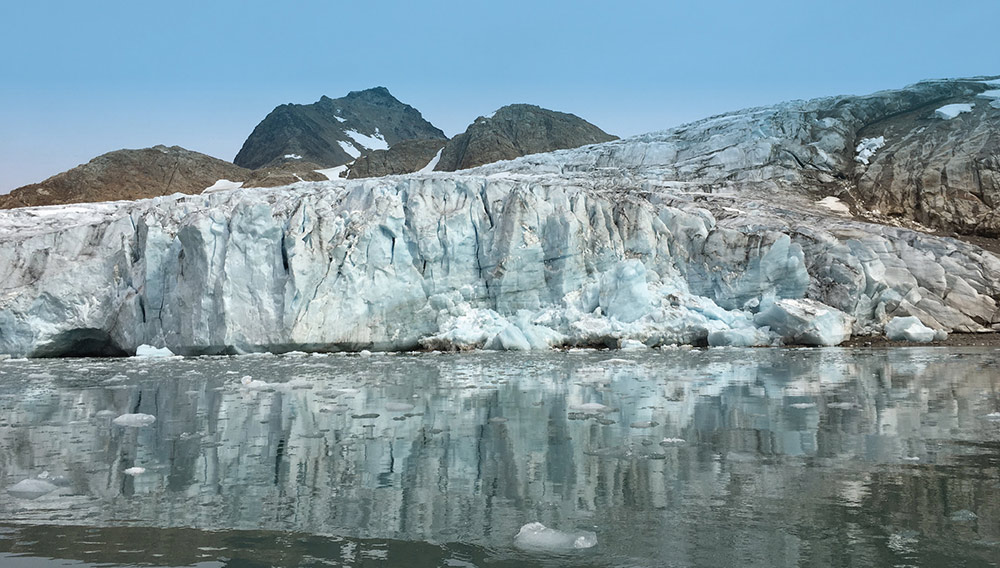
According to the Inter-governmental Panel on Climate Change, the oceans could rise anywhere from eight inches to more than four feet by the year 2100. Such a range reflects the uncertainty inherent in making such a prediction; it’s unclear how successfully the world’s economies will reduce their carbon emissions, and it’s still largely a mystery as to how polar ice will respond to a changing climate.
“There is so much uncertainty in the climate model that projects sea level rise, and one reason for this is because we don’t understand what’s happening beneath the ice,” says Maryam Rahnemoonfar, an associate professor with dual appointments in civil and environmental engineering and computer science and engineering. “If we can more precisely calculate the ice thickness and the snow accumulation over years and study the spatial-temporal changes that happen over the years, we can better calibrate these models for more precise projections.”
Measuring sea and land ice is a complex task. Polar regions are difficult to access regularly, and ice is extremely dynamic in how it moves and melts. And though bedrock can influence the behavior of ice sheets, it’s often so far below the ice surface that it’s challenging to study. In addition to ground-based measurements, satellite remote sensing and airborne surveys using lidar and radar sounding can give researchers insight into how ice changes in terms of extent, thickness, and movement. Refining these methods to provide more accurate projections is essential in helping coastal communities prepare for the potential increase in flood risk.
With 40 percent of the world’s population living within 100 kilometers (or about 62 miles) of a coastline, the economic consequences of rising sea levels will be huge. Better models will enable communities and governments to mitigate those impacts.
To that end, Rahnemoonfar is leading several projects to improve the accuracy of current climate models. She and her team have developed a machine learning model that incorporates the physical laws governing polar ice behavior to better calibrate simulations and predictions related to sea ice dynamics.
“Previous models focused on either the velocity or the concentration of the ice, but we developed a model that can actually predict those simultaneously,” she says. “This project develops a novel neural network architecture to predict daily sea ice concentration and drift, allowing information sharing between the tasks to improve prediction performance.”
In a second project, they developed an experimental machine learning model called a multibranch, spatiotemporal graph neural network that could work in tandem with information generated by the radar sensors used on land ice. The model can more efficiently process the huge amount of data collected by the radar, plus, it can use the radar data generated from the top layers of ice, which is less noisy and more accurate than results from deeper layers, and use that to predict the thickness of deeper layers.
A third project develops a graph neural network emulator for the ice sheet and sea level system model. “The existing numerical and physical models are super expensive and highly computational,” she says. “We’ve been able to show that our model uses fewer resources to work faster and with the same accuracy.”
Reducing uncertainty in sea level rise projections, she says, will enable communities to adapt to future realities.
“Better models will help people better prepare.”